Introduction
This web page describes the properties of the Volatility Response Model (VRM) identified to-date. The name given to the mathematics, the Volatility Response Model, is also explained.
Contents
General Information
Throughout this website, the charts presented have the following properties:
- Times are New York local time plus one hour.
- All H and L levels at daily and weekly timescales calculated by the VRM are shown as continuous lines on the charts.
- All sentiment levels at daily and weekly timescales calculated by the VRM (highest, lowest and S1) are shown as dashed lines on the charts.
- An Exponential Moving Average (EMA) channel, consisting of EMA(7) drawn in red and EMA(4) drawn in blue, is used to show the interaction of the FX pair with VRM levels.
- Charts show the mid price between bid and ask, the name of the FX pair and the date in the format YYYY-MM-DD.
- Charts with four-hour candlesticks have the first candlestick of the week on Sunday ending at midnight London local time.
- The top, middle and bottom of the Long Term Trend Channel (LTTC) are drawn in green.
- The top, middle and bottom of the Short Term Trend Channel (STTC) are drawn in blue.
Sentiment levels
The highest, lowest and S1 sentiment levels at both the daily and weekly timescales allow the user to assess the sentiment of an FX market.
In between the highest and lowest daily sentiment levels, the FX market cannot agree on sentiment one day through eight days into the future. This is also true for the highest and lowest weekly sentiment levels. Trading between these levels is best done at shorter timescales.
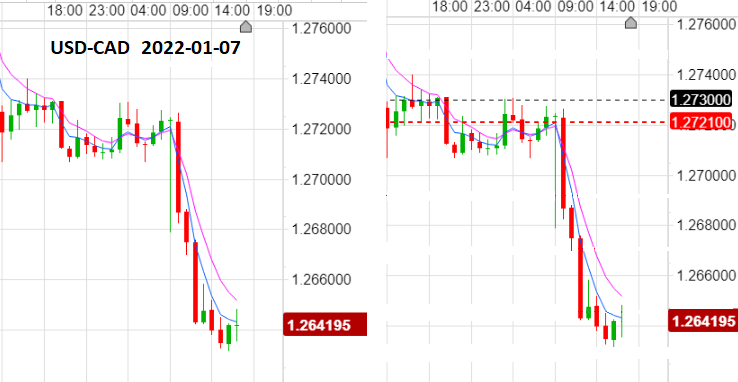
Here is an example of the USD-CAD exchange rate on the day of the US non farm payroll news on 7th January 2022, which occurred at 9:30 am. The left chart shows the one-hour candlestick chart. The chart on the right shows the daily S1 sentiment level (black dashed line) and the lowest daily sentiment level (red dashed line). Without the VRM levels to the left, the FX markets has support at 21:00 through 02:00 and resistance at 04:00. To the right, the USD-CAD was testing the daily sentiment level S1 at 1.2730 and then the lowest daily sentiment level 1.2721. The VRM sentiment levels showed that the market was bearish prior to the news, and indeed the USD-CAD fell on the non farm payroll announcement.
EMA channel
An Exponential Moving Average (EMA) Channel lets the user evaluate the interaction of the FX price action with a VRM level. Using EMA(4) (drawn in blue) and EMA(7) (drawn in red) for the EMA channel sides allows the user to see how the price action reacts as it approaches and interacts with a VRM level.
Here are some definitions for the EMA channel:
- A trending EMA channel has the channel sides continuing in the same direction.
- A falling EMA channel has EMA(7) > EMA(4).
- A rising EMA channel has EMA(7) < EMA(4).
- A reversal has the EMA channel sides cross over in one candlestick AND then stay crossed over in the next candlestick. NOTE: this takes two candlesticks.
- An EMA channel reversal can occur at a smaller timescale while the EMA channel is still trending at the higher timescale. So at the short timescale the EMA channel has reversed, but at the larger timescale this is just a retracement back to the longer timescale EMA channel.
THE VRM LEVELS STEER THE EMA CHANNEL AT ALL TIMESCALES.
Spinning top and doji candlesticks
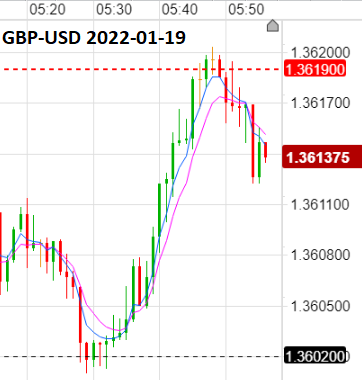
The chart below shows the EMA channel interacting with VRM sentiment levels at 1.3619 and 1.3602 of GBP-USD at the one-minute timescales. The EMA channel widens as the FX pair interacts with the VRM levels. The VRM levels resist the FX pair passing through, causing the spinning top and doji candlesticks to appear.
Spinning tops and dojis that are not explained by the VRM levels can then be ignored. This is useful if a trader using a different trading strategy wants an explanation for a spinning top or doji candlestick.
Volatility
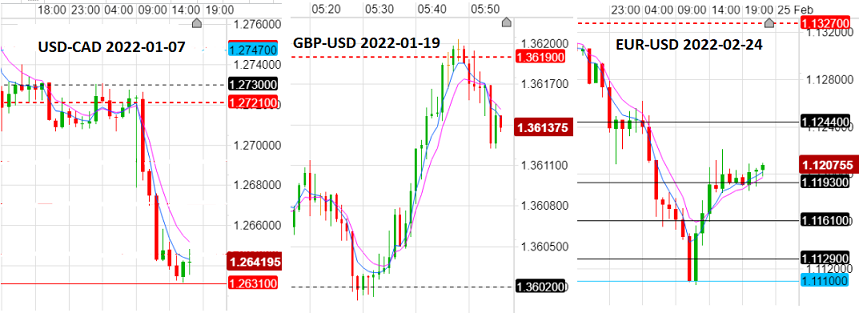
In this section we explain why the mathematics is called the Volatility Response Model (VRM). Two of the charts below have already been used in previous sections.
For the USD-CAD chart the only addition is the L level for USD-CAD at 1.2631. The USD-CAD chart shows the volatile reaction of the USD-CAD pair to US non farm payroll news falling to this level.
The chart in the middle shows a typical day where the GBP-USD cannot decide sentiment and the FX pair moves sideways.
The chart to the right shows the EUR-USD response about its weekly L levels to the invasion of the Ukraine by Russia. From 24:00 the EUR-USD spends at least 5 hours about the weekly L level 1.1244. Then falls to the bottom of its Long Term Trend Channel at 1.1110. Then rebounds at this level.
In all three cases the VRM levels explain the response of the market to the sentiment at the time. Whatever the sentiment of the FX market, the market will always respond around the VRM levels. Hence we call the mathematics the Volatility Response Model (VRM).

Rebounds
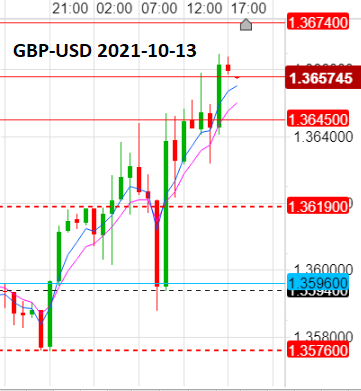
Rebound response of an FX market about a VRM level is another useful property. The chart below shows the GBP-USD at the one-hour timescale. When an FX market closes the hour within the bid-ask spread of a VRM level, then rebounds often occur. These can be seen in the chart below at 21:00, 02:00 and 10:00.
Arbitrage and triplets
All the FX pairs form part of a triplet owing to the continuous effect of arbitrage. For instance:
EUR-GBP X GBP-USD = EUR-USD
This has important implications for the VRM algorithm. When one component of a triplet rebounds off its VRM level, another component can rebound off its VRM level at the same time. On other occasions an FX pair will rebound just because another FX pair rebounded off its VRM level. FX pairs in a triplet follow each other about their respective VRM levels.
When only trading one FX pair, it is still advantageous to chart the VRM levels of the other FX pairs in a triplet. The additional information of the other two FX pairs is very useful. The trader can see which FX pair is following another FX pair or is just onlooking.
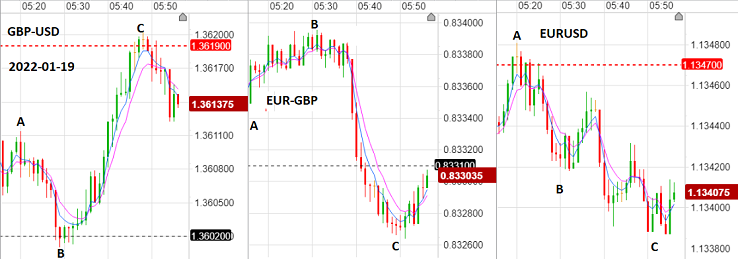
Here is an example of EUR-GBP, GBP-USD and EUR-USD described in chronological order at times A, B and C about their respective sentiment levels.
A EUR-USD rebounds off its level 1.1347, GBP-USD follows and EUR-GBP starts to sell GBP.
B GBP-USD rebounds off its level 1.3602, EUR-USD follows and EUR-GBP starts its fall.
C GBP-USD arrives at its level 1.3619 and rebounds. EUR-GBP follows and EUR-USD looks on.
As an interesting aside, the GBP-USD features in many triplets and is often leading a triplet. Had the United Kingdom accepted the EURO then the FX markets of the world would have been disrupted without the GBP leadership.
Stop Loss
The optimum position to start an FX trade is close to a VRM level, with the stop loss on the other side of the VRM level for protection. Starting a trade midway between VRM levels runs the risk of the FX market moving back to a VRM level, resulting in a larger variation of the profit and loss. In the previous Arbitrage and Triplets section, the optimum start of a long GBP-USD trade would be after the rebound off 1.3602 with a stop loss below this level.
Take Profit
The most profitable trades occur between largely spaced VRM levels. Trades in the middle of a cluster of closely spaced VRM levels run the risk of the FX pair being trapped. This quite often happens at the end of the day when the FX pair arrives within its L or H levels, which tend to be clustered.
The take profit should be set at a VRM level padded out by at least the bid-ask spread. The asking price may arrive at the VRM level, but the bid price may not. Or vice versa, the bid price may arrive at the VRM level, but the asking price may not. In the previous Arbitrage and Triplets section the optimum take profit price of a long GBP-USD trade would be set just below the sentiment level at 1.3619.
VRM level pass through
An FX market can take more than an hour to pass through a VRM level. The FX market has only conclusively passed through a VRM level when the close of a one-hour candlestick is on the other side of a VRM level and the one-hour EMA channel has also passed through the VRM level.
It is therefore preferable not to start a trade when an FX market is approaching a VRM level.
Intraday timescales
Besides one-minute and one-hour timescales shown above, other candlestick timescales such as three-minute, five-minute, 10 minute, 15 minute, 3 hours or 4 hours can also be used. As the timescales get smaller the EMA channel will have more reversals and therefore provide more buy or sell signals.
At longer timescales the one-hour candlestick EMA channel may have reversed while the four-hour candlestick EMA channel is still trending, leading to a large variation in running profit and loss.
If a larger timescale is used for trading, the one-minute and five-minute candlestick EMA channel can still be used to start a trade. For instance, the trade will start when the five-minute candlestick EMA channel is trending in the same direction as the four-hour candlestick EMA channel.
At all intraday timescales the price action will still show widening of the EMA channel, spinning top and doji candlesticks as the FX pair approaches a VRM level.
An FX market can take some time to interact with a VRM level as it discovers the level. Observing the price action about the VRM levels at larger timescales with the corresponding candlestick EMA channel can reveal the bigger picture trend direction.
Weekly timescales - Long Term Trend Channel (LTTC)
Apart from the weekly sentiment levels and high and low levels calculated by the VRM, the VRM also calculates a Long Term Trend Channel (LTTC) using the historic weekly high, low and close data extrapolated one week into the future. The FX pair also interacts with the top, middle and bottom of this LTTC.
As long as the user is prepared to increase their stop loss sufficiently to allow for variations in profit and loss within the LTTC, then the LTTC can be used to trade.
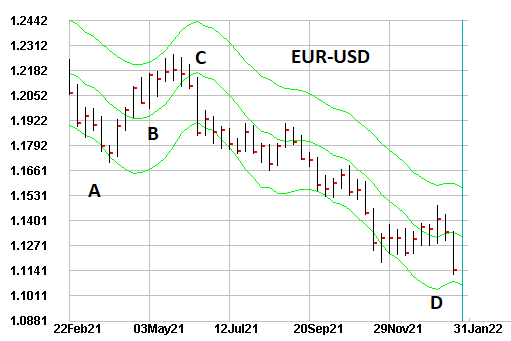
The chart below shows the LTTC of EUR-USD from February 2021 through January 2022. The chart shows the typical characteristics of an LTTC. These are:
A When the LTTC is falling, the weekly price action is below the middle of the LTTC.
B When the LTTC is rising, the weekly price action is above the middle of the LTTC.
C The weekly price action falls below the middle of the LTTC, and the LTTC starts to fall.
D The weekly price action tries to find support on the middle of the LTTC and fails.
The middle of the LTTC is therefore a level of support for a rising LTTC and a level of resistance for a falling LTTC and can be used to hide a stop loss behind it.
Remember that the range top to bottom of the LTTC for the next future time period of one week is the potential movement of the price in the future.
Daily timescales - Short Term Trend Channel (STTC)
Apart from the daily sentiment levels and high and low levels calculated by the VRM, the VRM also calculates a Short Term Trend Channel (STTC) using the historic daily high, low and close data extrapolated one day into the future. The FX pair also interacts with the top, middle and bottom of this STTC.
As long as the user is prepared to increase their stop loss sufficiently to allow for variations in profit and loss within the STTC, then the STTC can be used to trade.
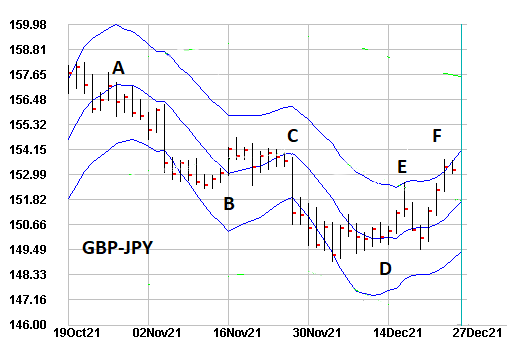
The chart below shows the STTC of GBP-JPY from October 2021 through December 2021. The chart shows the typical characteristics of a STTC. These are:
A The FX falls through the middle of the STTC, and the STTC starts to fall.
B The FX breaks up through the middle of the STTC, but not for long.
C The FX then falls below the middle of the STTC.
D The FX finds support on the middle of the STTC channel.
E The FX rebounds from the top of the STTC.
F The FX continues to rise above the middle of the STTC.
The middle of the STTC is therefore a level of support for a rising STTC and a level of resistance for a falling STTC and can be used to hide a stop loss behind it.
Remember that the range top to bottom of the STTC for the next future time period of one day is the potential movement of the price in the future.
Colliding trend channels
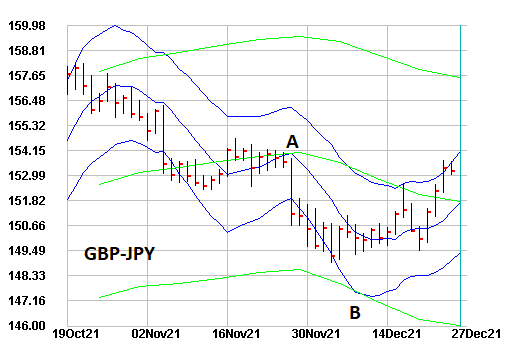
The user should also always be on the lookout for potential collisions between the top, middle or bottom of the Short Term Trend Channel (STTC) and the top, middle or bottom of the Long Term Trend Channel (LTTC). Here is the same GBP-JPY chart again with the LTTC drawn in green showing:
A The collision of the middle of the STTC with the middle of the LTTC.
This explains the price action between B and C in the previous section.
B The collision of the bottom of the STTC with the bottom of the LTTC.
In general, when the price action closes the day on the other side of the top, middle or bottom of the STTC or LTTC then this is a signal for a change from bullishness to bearishness or vice versa.
Summary
The VRM is an algorithm that calculates future daily and weekly support and resistance levels and future short and long term trend channels. These form the road map through which the price action will move tomorrow and next week, whatever the volatility. Click on the link below to see how this information can be used to trade the FX markets.