Introduction
The Volatility Response Model (VRM) is an algorithm that calculates short and long term trend channels and daily and weekly support and resistance levels. These form the road map through which the price action will move tomorrow and next week.
The levels can be used on charts to follow the price action using an Exponential Moving Average (EMA) channel described in more detail on our Properties web page.
Properties >Examples of the different ways in which the VRM can be used are shown in the sections below.
The last section on this web page describes the track record achieved by the VRM on the Forex Forum at trade2win.com.
Contents
General
Throughout this website the charts presented have the following properties:
- Times are New York local time plus 1 hour.
- All H and L levels calculated by the VRM are shown as continuous lines on the charts.
- All sentiment levels at daily and weekly timescales (highest, lowest and S1) are shown as dashed lines on the charts.
- An Exponential Moving Average (EMA) channel, consisting of EMA(7) drawn in red and EMA(4) drawn in blue, is used to show the interaction of the FX pair with VRM levels.
- Charts show the mid price between bid and ask, the name of the FX pair and the date in the format YYYY-MM-DD.
- Charts with four-hour candlesticks have the first candlestick of the week on Sunday ending at midnight London local time.
- The top, middle and bottom of the Long Term Trend Channel (LTTC) are drawn in green.
- The top, middle and bottom of the Short Term Trend Channel (STTC) are drawn in blue.
Trader's Tool
The VRM is an algorithm that provides a road map of daily and weekly support and resistance levels through which the price will move in the future. These levels are sought by other trading strategies. For instance a mean reversion trader will look for zones where retracement will happen back to their mean. The highest and lowest VRM sentiment levels are the last levels of bearishness and bullishness that correspond to these zones. Similarly, traders who use support and resistance levels or trend lines can compare their values to the VRM levels. The VRM levels can be used in conjunction with other analysis tools to do the following:
- Explain intraday support and resistance levels.
- Explain weekly support and resistance levels.
- Explain short and long term tends.
- Check if their intended trade is facing a VRM level where rebounds and volatility can occur.
- Compare the VRM levels to levels calculated by other trading methods to look for confirmation.
- Help the trader to identify spinning top and doji candlesticks not at VRM levels which can therefore be rejected as false signals.
- Assess the sentiment of the FX market in terms of the VRM sentiment levels.
Optimum trading using the VRM
- Assess the sentiment of the market at daily timescales using the highest, lowest and S1 daily sentiment levels.
- Assess the sentiment of the market at weekly timescales using the highest, lowest and S1 weekly sentiment levels.
- Use the one-minute and five-minute candlesticks and EMA channel to observe the FX pair interacting with the VRM level.
- Watch out for widening EMA channel and spinning top and doji candlesticks as the FX approaches a VRM level at each timescale.
- Watch out for rebounds as the FX pair closes the hour within the bid-ask spread at a VRM level.
- Always assess the price action of an FX pair and the other two FX pairs in a triplet relative to their respective VRM levels. This requires three charts with daily VRM levels for the FX pairs in a triplet and three charts with weekly VRM levels for the FX pairs in a triplet.
- Place stop losses behind VRM levels.
- Set take profits at far away VRM levels padded out by the bid-ask spread.
- FX pairs have passed through a VRM level when they close the hour on the other side of a VRM level and their EMA channel has crossed over as well.
- Assess the FX pair relative to its Long Term Trend Channel (LTTC).
- Assess the FX pair relative to its Short Term Trend Channel (STTC).
- Look out for collisions of the top, middle and bottom of the STTC with the top, middle and bottom of the LTTC.
- Look out for collisions of the FX pair with the top, middle and bottom of the STTC.
- Look out for collisions of the FX pair with the top, middle and bottom of the LTTC.
- Start the trade when the one-minute EMA channel of the FX pair is in the direction of the trade. Buy when EMA channel is rising. Sell when the EMA channel is falling.
One-minute timescales
One-minute candlestick charts with the corresponding EMA channel should always be used to see the first interaction of the FX pair as it finds the VRM level. As always the user must chart all three FX pairs in a triplet to see which pair is leading, following or just onlooking. Optimum trades start close to a VRM level with the stop loss on the other side of that level and the take profit just in front of a distant VRM level padded out by the bid-ask spread.
One-minute charts are most useful for fast-moving markets - for instance, when interest rates are announced.
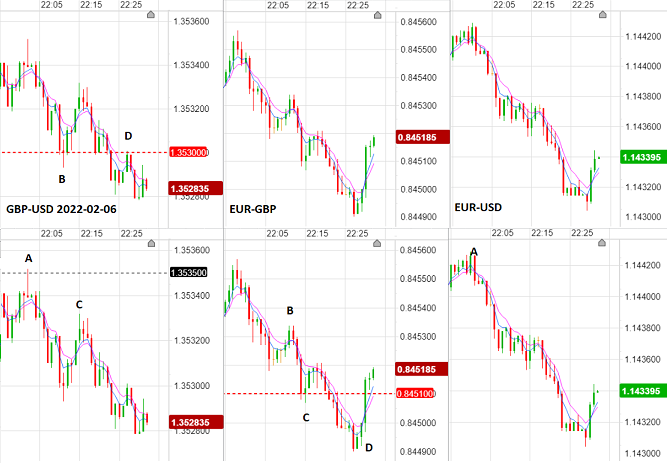
Here is an example of the one-minute charts for the triplet GBP-USD, EUR-GBP and EUR-USD. The three top charts show their respective weekly VRM levels. The three bottom charts show their respective daily VRM levels.
EUR-USD has no weekly or daily VRM levels in sight and so is following or watching the other two FX pairs in the triplet. GBP-USD has a weekly S1 sentiment level at 1.3530 and a daily S1 sentiment level at 1.3535. EUR-GBP has only its lowest daily sentiment level 0.8451.
Follow the charts below in chronological order at A, B, C and D to see their respective EMA channels widening with spinning top and doji candlesticks on their rebounds. You can see which FX pair is leading and which FX pair is following.
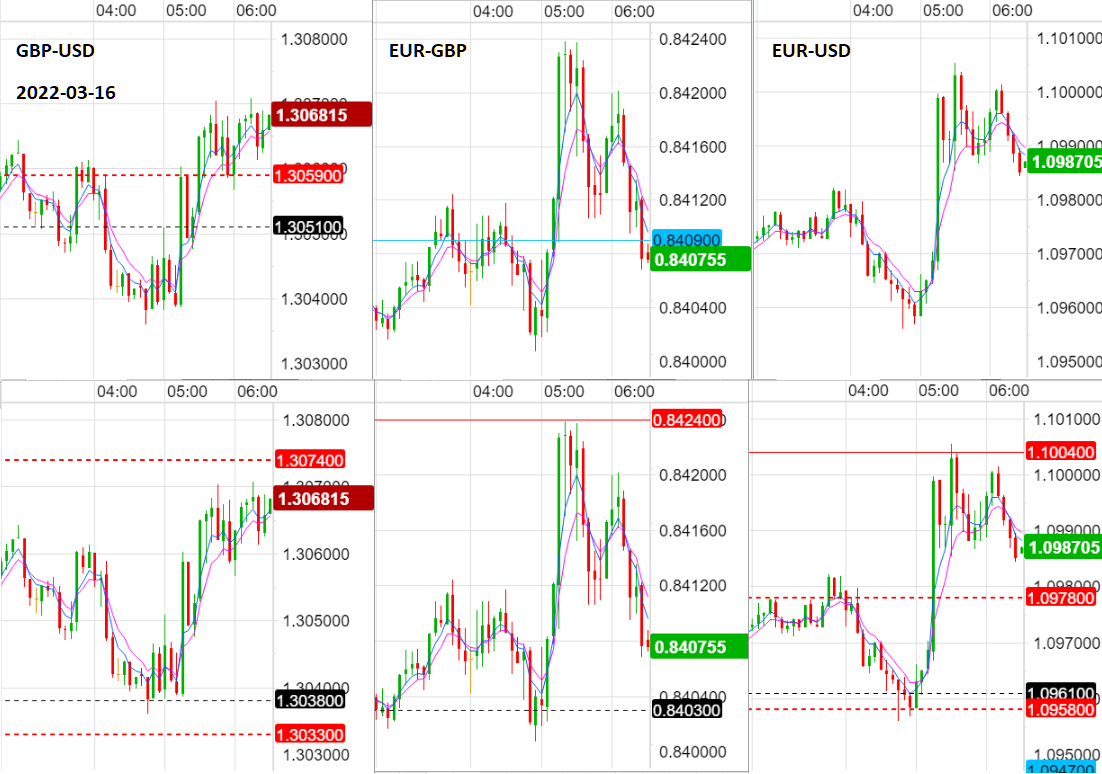
Five-minute timescales
Where the trader can accept more variance of the profit and loss then increase the timescale to five-minute candlestick charts with the corresponding EMA channel. Then observe the interaction as the FX market finds the VRM level. As always, the user must chart all three FX pairs in a triplet to see which pair is leading, following or just onlooking. The three FX pairs will move about their respective VRM levels in a coordinated fashion. Here is an example of a five-minute candlestick chart for the GBP-USD, EUR-GBP and EUR-USD triplet. Top charts show weekly VRM levels. Bottom charts show daily VRM levels.
One-hour timescales
One-hour candlestick charts will trend further before a reversal of their EMA channel. At the same time, the profit and loss of the trade position will vary more. However, the VRM levels will still steer the price action at this timescale.
At the one-hour timescale, trades should be started when the one-minute EMA channel is evolving in the same direction as the one-hour EMA channel. Optimally the trader should start in the wick of a one-hour candlestick
Be on the lookout for rebounds when the one-hour candlestick closes the hour at or within the bid-ask spread at a VRM level. As always the user must chart all three FX pairs in a triplet to see which pair is leading, following or just onlooking.
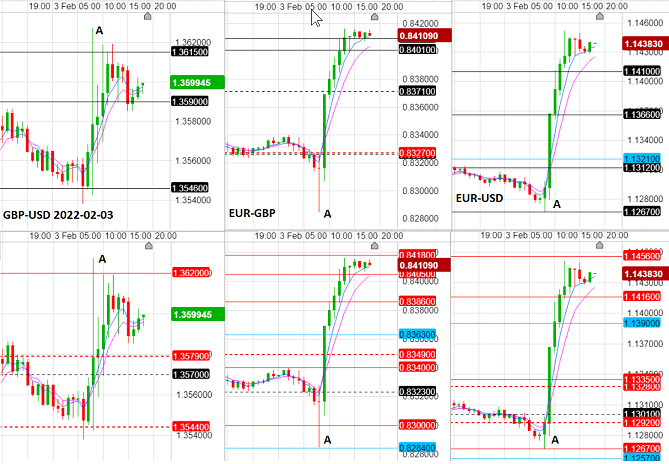
Here is an example of the one-hour charts for the triplet GBP-USD, EUR-GBP and EUR-USD. The three top charts show their respective weekly VRM levels. The three bottom charts show their respective daily VRM levels.
A major EUR rebound in the 08:00 hour is marked A. See how EUR-GBP rebounded off the bottom of its Short Term Trend Channel (STTC) at 0.8284. EUR-GBP has a spinning top candlestick in this hour. EUR-USD rebounded off its daily L level 1.1267 and its weekly H level 1.1267. GBP-USD just followed. Notice how EUR-USD has the same level 1.1267 at both daily and weekly timescales. This often happens, and is remarkable because these levels were calculated with completely different data sets.
Four-hour timescales
At the even larger timescale of four hours the EMA channel will take even longer to reverse as it rebounds off a VRM level. The trade at these timescales runs the risk of starting a reversal during a four-hour candlestick. Trades at the four-hour time period should be assessed for the risk of reversal by looking ahead for VRM sentiment levels that could cause the reversal. The four-hour candlestick trade should be assessed every hour to see if this event is possible ahead in time.
At the four-hour timescale, trades should be started when the one-minute EMA channel is evolving in the same direction as the one-hour EMA channel. Optimally the trader should start in the wick of a four-hour candlestick.
Watch four-hour candlestick evolve using one-minute and one-minute timescales interacting with VRM levels
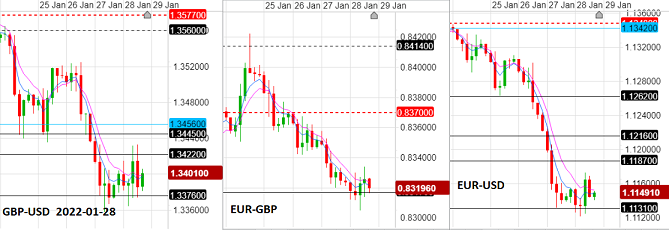
Be on the lookout for rebounds when the price action closes the four hours at or within the bid-ask spread at a VRM level. As always, the user must chart all three FX pairs in a triplet to see which pair is leading, following or just onlooking. Here is an example of the four-hour candlestick charts for the GBP-USD , EUR-GBP and EUR-USD triplet evolving about their respective weekly VRM levels during the week ending 28 January 2022. Widening EMA channels and spinning top and doji candlesticks can be seen. Remember that on each day of the week each of these FX pairs will have their own daily VRM levels that should be monitored as well. See how GBP-USD and EUR-USD cascade down their respective weekly L levels.
Daily and weekly timescales
Where large swings in profit and loss are acceptable, the Long Term Trend Channel (LTTC) and the Short Term Trend Channel (STTC) can be used.
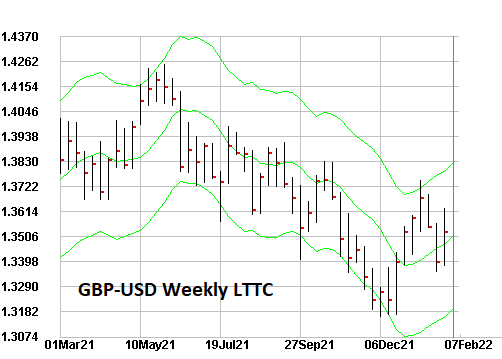
For the LTTC, the weekly candlesticks will trend above the middle of the LTTC for a bullish market and below the middle of the LTTC for a falling market. Always be on the lookout for rebounds of the FX pair off the top, middle and bottom of the LTTC.
Here is an example of GBP-USD over the period March 2021 through February 2022.
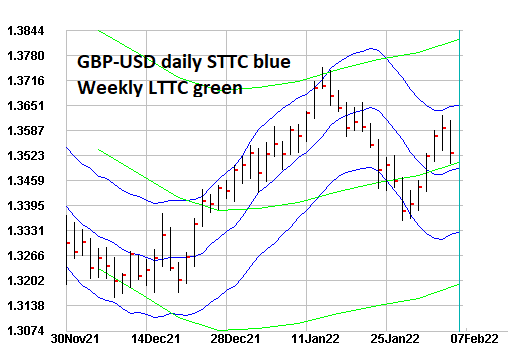
For the STTC, the daily candlesticks will trend above the middle of the STTC for a bullish market and below the middle of the STTC for a falling market. Always be on the lookout for rebounds of the FX pair off the top, middle and bottom of the STTC and rebounds off the top, middle and bottom of the LTTC.
Here is an example of GBP-USD over the period November 2021 through February 2022.
trade2win Forex Forum
VRM predictions have been posted on the trade2win.com Forex forum on a daily basis at the start of the market. These predictions covered the 24 hour period ending 5 pm New York local time. Actual results for this period were then posted to the forum thread after the New York close. So far there have been more than 200,000 views of the thread. Click on the link below to see the predictions and results to date.
trade2win Forex Forum - Predicting future FX support and resistance levels using mathematicsSummary
The VRM provides a road map of future support and resistance levels for an FX market. The interaction of the price with these levels as the market evolves is best seen with an Exponential Moving Average (EMA) channel. To find out more about the VRM, read the Theory web page, then follow the link at the bottom of that page to learn more about the properties of the VRM.
Still have more questions? Then check out the FAQ web page.